 कोयला मंत्रालय




Coal & Lignite Resource
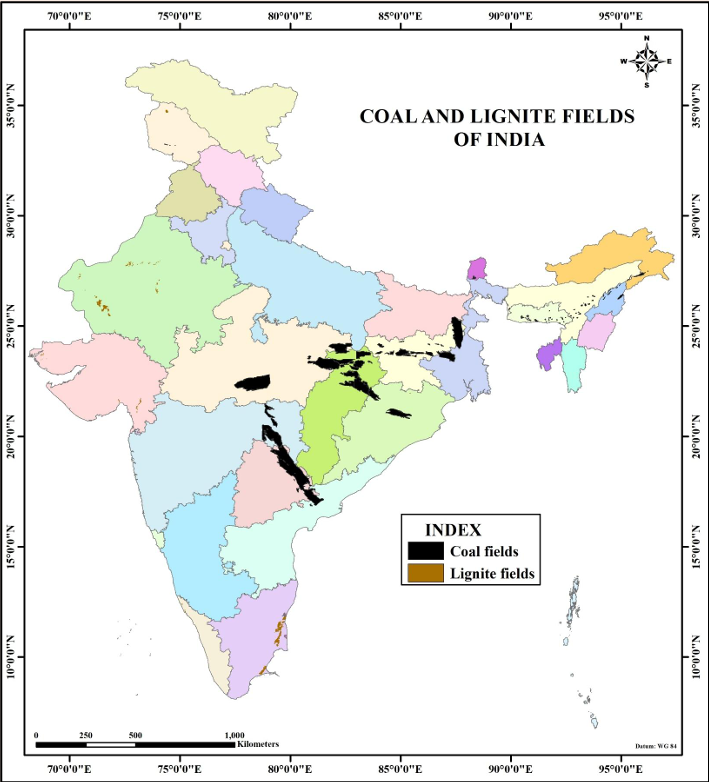
According to the National Coal Inventory of 2026, published by Geological Survey of India based on resources estimated by CMPDI, GSI, MECL, SCCL, and some private/public entrepreneurs, a maximum depth of 1800 m for coal and 300 m for lignite; the total estimated coal and lignite resource of India is 411.53 billion tonnes and 48.19 billion tonnes respectively as on 01.04.2026.
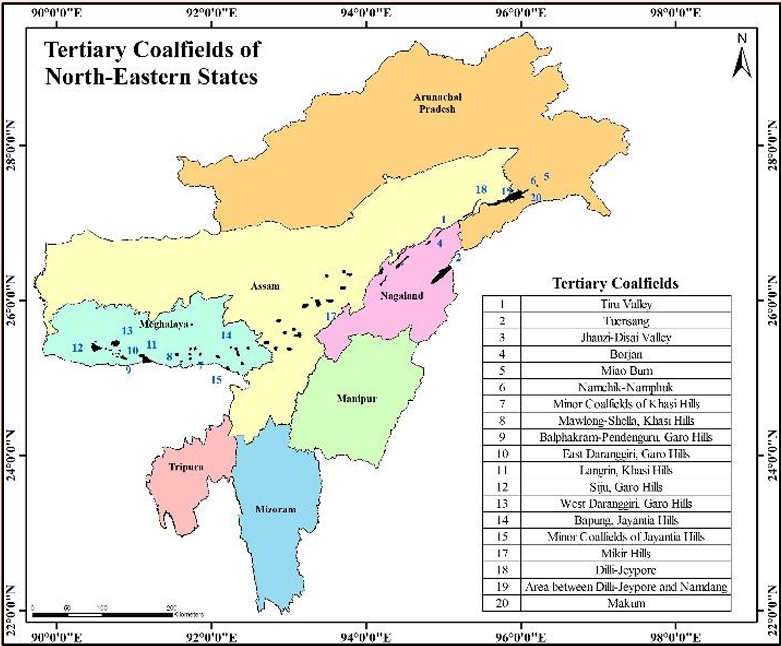
With Continuous exploration efforts in 65 coal fields (45 Gondwana & 20 Tertiary Coalfields), reconnaissance resource data of 5 Jammu & Kashmir coal fields and 15 lignite fields have resulted in substantial augmentation of the geological resources of coal and lignite.
| As on | Measured | Indicated | Inferred | Total | Growth Percent |
|---|---|---|---|---|---|
| 1st April 2021 | 177.18 | 146.95 | 28.00 | 352.13 | 2.3% |
| 1st April 2022 | 187.11 | 147.25 | 27.05 | 361.41 | 2.6% |
| 1st April 2023 | 199.90 | 151.68 | 26.62 | 378.21 | 4.4% |
| 1st April 2024 | 212.21 | 148.72 | 28.50 | 389.42 | 2.9% |
| 1st April 2025 | 220.41 | 149.05 | 31.26 | 400.72 | 2.7% |
| 1st April 2026 | 233.49 | 142.79 | 35.25 | 411.53 | 2.6 % |
*Resource for the year 2020: 344.02 Billion tonnes.
Graphical Representation of the category-wise augmentation of Coal resource

Category-wise Coal resources in MTOE as on 1st April’2026
| Measured | Indicated | Inferred | Total |
|---|---|---|---|
| 150571.56 | 92084.37 | 22731.25 | 265387.18 |
Note:For the purpose of calculation, the following conversion factors have been applied used
i) metric tonne= 27 GJ (for coal)
ii) 1 GJ = 2.388458966275*10 -8 MTOE
Ref - Conversion Factors for Bioenergy and Link
| State | Measured(331) | Indicated(332) | Inferred(333) | Total Resource | Percentage share |
|---|---|---|---|---|---|
| Odisha | 55.01 | 38.78 | 7.19 | 100.99 | 25.94 % |
| Jharkhand | 60.29 | 27.12 | 5.84 | 93.25 | 22.76 % |
| Chhattisgarh | 45.46 | 38.34 | 1.46 | 85.26 | 21.00 % |
| West Bengal | 18.75 | 11.42 | 4.21 | 34.39 | 8.49 % |
| Madhya Pradesh | 16.41 | 11.80 | 5.35 | 33.56 | 8.48 % |
| Telangana | 11.26 | 8.63 | 3.40 | 23.29 | 5.66 % |
| Maharashtra | 8.34 | 3.26 | 1.98 | 13.59 | 3.42 % |
| Bihar | 2.35 | 6.97 | 0.04 | 9.35 | 2.54 % |
| Andhra Pradesh | 1.02 | 2.37 | 0.78 | 4.17 | 1.01 % |
| Uttar Pradesh | 0.88 | 0.18 | 0.00 | 1.06 | 0.26 % |
| Meghalaya | 0.10 | 0.02 | 0.47 | 0.58 | 0.14 % |
| Assam | 0.00 | 0.01 | 0.00 | 0.01 | 0.13 % |
| Nagaland | 0.01 | 0.02 | 0.48 | 0.51 | 0.13 % |
| Sikkim | 0.00 | 0.06 | 0.04 | 0.10 | 0.02 % |
| Arunachal Pradesh | 0.06 | 0.02 | 0.01 | 0.09 | 0.02 % |
| Total | 233.48 | 142.81 | 35.24 | 411.53 | 100 % |
Geological coal resources of Union Territory of Jammu & Kashmir
State: Jammu & Kashmir
(Resource in Million Tonnes)
| Coalfield | Depth (m) | Reconnaissance (Drilling) | Reconnaissance (Mapping) | Total |
|---|---|---|---|---|
| Ladda (Jangalgali) | 0-300 | 0.00 | 112.50 | 112.50 |
| Kalakote | 0-300 | 6.69 | 0.00 | 6.69 |
| Metka | 0-300 | 2.25 | 0.00 | 2.25 |
| Mahogala | 0-300 | 8.76 | 0.00 | 8.76 |
| Chinkah | 0-300 | 3.90 | 0.00 | 3.9 |
| Total | 0-300 | 21.6 | 112.5 | 134.1 |

Grade wise & state-wise Coal and Lignite Resources as of 01.04.2026:
| Resource Category |
Grade | States | GRAND TOTAL |
|||||||||||
|---|---|---|---|---|---|---|---|---|---|---|---|---|---|---|
| West Bengal | Jharkhand | Bihar | Madhya Pradesh | Chhattisgarh | Uttar Pradesh | Maharashtra | Odisha | Andhra Pradesh |
Telangana | Assam | Sikkim | |||
| Measured (331) | G1-G3 | 0.17 | 0.34 | 0.00 | 0.24 | 0.75 | 0.00 | 0.01 | 0.04 | 0.00 | 0.09 | 0.00 | 0.00 | 1.65 |
| G4-G5 | 2.59 | 0.97 | 0.00 | 1.12 | 1.27 | 0.00 | 0.22 | 0.38 | 0.00 | 0.52 | 0.00 | 0.00 | 7.07 | |
| G6 | 4.89 | 1.56 | 0.02 | 2.48 | 1.66 | 0.01 | 0.87 | 0.56 | 0.00 | 1.99 | 0.00 | 0.00 | 14.03 | |
| G7-G8 | 5.07 | 5.22 | 0.37 | 4.34 | 4.54 | 0.28 | 2.81 | 1.83 | 0.01 | 2.58 | 0.00 | 0.00 | 27.04 | |
| G9-G14 | 5.68 | 30.51 | 1.79 | 8.20 | 36.91 | 0.60 | 4.40 | 55.18 | 0.89 | 6.07 | 0.00 | 0.00 | 150.23 | |
| G15-G17 | 0.04 | 0.47 | 0.17 | 0.08 | 2.14 | 0.00 | 0.08 | 5.95 | 0.12 | 0.01 | 0.00 | 0.00 | 9.04 | |
| Total | 18.45 | 39.07 | 2.35 | 16.47 | 47.27 | 0.88 | 8.38 | 63.93 | 1.02 | 11.26 | 0.00 | 0.00 | 209.08 | |
| Indicated (332) | G1-G3 | 0.24 | 0.04 | 0.01 | 0.34 | 0.44 | 0.00 | 0.03 | 0.11 | 0.00 | 0.14 | 0.00 | 0.00 | 1.35 |
| G4-G5 | 1.27 | 0.22 | 0.10 | 1.54 | 0.87 | 0.00 | 0.15 | 0.47 | 0.00 | 0.43 | 0.00 | 0.00 | 5.06 | |
| G6 | 3.03 | 0.92 | 0.29 | 2.62 | 2.30 | 0.00 | 0.61 | 0.78 | 0.00 | 1.06 | 0.00 | 0.00 | 11.62 | |
| G7-G8 | 2.67 | 4.19 | 0.96 | 2.37 | 6.23 | 0.10 | 0.95 | 2.68 | 0.02 | 1.71 | 0.01 | 0.05 | 21.94 | |
| G9-G14 | 3.84 | 11.67 | 5.40 | 3.11 | 25.76 | 0.08 | 1.48 | 27.67 | 2.13 | 5.28 | 0.01 | 0.01 | 86.42 | |
| G15-G17 | 0.03 | 0.26 | 0.20 | 0.22 | 1.33 | 0.00 | 0.06 | 2.21 | 0.21 | 0.01 | 0.00 | 0.00 | 4.52 | |
| Total | 11.07 | 17.30 | 6.97 | 10.20 | 36.94 | 0.18 | 3.27 | 33.93 | 2.37 | 8.63 | 0.01 | 0.06 | 130.92 | |
| Inferred(333) | - | 4.08 | 4.14 | 1.14 | 5.58 | 1.39 | 0.00 | 2.42 | 8.90 | 0.78 | 3.40 | 0.00 | 0.04 | 31.87 |
| Grand Total | 33.59 | 60.50 | 10.46 | 32.25 | 85.59 | 1.06 | 14.08 | 106.76 | 4.17 | 23.29 | 0.01 | 0.10 | 371.86 | |
| Coke Type | States | Total Resource | ||||
|---|---|---|---|---|---|---|
| West Bengal | Jharkhand | Bihar | Madhya Pradesh | Chhattisgarh | ||
| Prime Coking | 0.00 | 5.44 | 5.32 | 0.00 | 0.00 | 5.44 |
| Medium Coking | 0.56 | 26.96 | 0.00 | 2.49 | 0.38 | 30.39 |
| Semi-Coking | 0.79 | 0.75 | 0.17 | 0.15 | 0.44 | 2.12 |
| Total | 1.35 | 33.15 | 5.49 | 2.64 | 0.82 | 37.95 |
| Item | States | Total | |||
|---|---|---|---|---|---|
| Assam | Arunachal Pradesh | Meghalaya | Nagaland | ||
| High Sulphur Coal | 0.51 | 0.09 | 0.59 | 0.52 | 1.71 |
Resource of different types of Indian Coal in Billion tonnes
SUMMARIZED TABLE
(Resource in Billion Tonnes)
| Depth Range (m) | Coking | Non-coking | High Sulphur | Grand Total | ||||
|---|---|---|---|---|---|---|---|---|
| Prime | Medium | Semi-coking | Non-coking | |||||
| Superior (G1-G6) | Inferior (G7-G17) | Ungraded | ||||||
| 0-300 | 0.00 | 12.56 | 0.49 | 21.86 | 168.38 | 8.16 | 1.50 | 212.95 |
| 0-600 | 4.60 | 4.64 | 0.00 | 0.45 | 5.69 | 0.03 | 0.00 | 15.41 |
| 300-600 | 0.00 | 7.80 | 1.08 | 14.26 | 98.16 | 15.90 | 0.21 | 137.41 |
| 600-1200 | 0.84 | 5.38 | 0.56 | 4.22 | 26.98 | 7.78 | 0.00 | 45.76 |
| 1200-1800 | 0.00 | 0.00 | 0.00 | 0.00 | 0.00 (0.07 in million tonnes) | 0.00 | 0.00 | 0.00 (0.07 in million tonnes) |
| 0-1200 | 5.44 | 30.39 | 2.12 | 40.79 | 299.20 | 31.87 | 1.71 | 411.53 |
Lignite Resource
The inventory of lignite resources for the year 2025-26 was prepared by compiling and collating updated information from different lignite exploration agencies, such as NLC India Ltd., Geological Survey of India (GSI), and Mineral Exploration Corporation Limited (MECL). The finalization of the inventory was done through close interaction between GSI and NLC. As of 1st April 2026, the total geological resource of lignite in the country stands at 48.19 billion tonnes.
| As on | Measured | Indicated | Inferred | Total | Growth % |
|---|---|---|---|---|---|
| 1st April 2021 | 7.37 | 25.65 | 12.99 | 46.20 | 0.4 % |
| 1st April 2022 | 7.50 | 25.70 | 14.15 | 47.36 | 2.4 % |
| 1st April 2023 | 7.51 | 25.70 | 14.15 | 47.36 | 0.0 % |
| 1st April 2024 | 7.96 | 25.23 | 14.09 | 47.29 | 0.0 % |
| 1st April 2025 | 7.96 | 25.30 | 14.09 | 47.37 | 0.2 % |
| 1st April 2026 | 8.01 | 26.10 | 14.08 | 48.19 | 1.7 % |
*Resource for the year 2020: 46.02 Billion tonnes.
Graphical Representation of the category-wise augmentation of Lignite resource in Billion Tonnes

Details of State-wise and category-wise Lignite resources are given as under: (Billion tonnes)
| State | Measured (331) | Indicated (332) | Inferred (333) | Total Resource | Percentage Share |
|---|---|---|---|---|---|
| Tamil Nadu | 5.476 | 22.211 | 10.636 | 38.323 | 79.5% |
| Rajasthan | 1.254 | 3.175 | 2.250 | 6.679 | 13.9% |
| Gujarat | 1.279 | 0.284 | 1.160 | 2.722 | 5.6% |
| Puducherry | 0.000 | 0.406 | 0.011 | 0.417 | 0.9% |
| Jammu & Kashmir | 0.000 | 0.020 | 0.007 | 0.028 | 0.1% |
| Kerala | 0.000 | 0.000 | 0.010 | 0.010 | 0.0% |
| Odisha | 0.006 | 0.000 | 0.000 | 0.006 | 0.0% |
| West Bengal | 0.000 | 0.001 | 0.003 | 0.004 | 0.0% |
| Total | 8.015 | 26.097 | 14.077 | 48.188 | 100% |
Category-wise Coal resources in MTOE as of 1st April’2026
| Measured | Indicated | Inferred | Total |
|---|---|---|---|
| 2871.45 | 9349.72 | 5043.20 | 17264.37 |
Note:For the purpose of calculation, the following conversion factors have been applied used
i) metric tonne= 15 GJ (for Lignite)
ii) 1 GJ = 2.388458966275*10 -8 MTOE
Ref:Conversion Factors for Bioenergy and Link